Geography Practical File
B.A. 2nd Semester
To create a practical file
follow these to complete your practical file
Front Page
- Name
- Enrollment No.
- Class or semester
- Roll No.
- Subject
- College name
B.A. 2nd Semester
Map projection refers to the process of representing the three-dimensional surface of the Earth onto a two-dimensional map. It enables to represent the Earth's features, such as landmasses, bodies of water, and geographic information, in a visually interpretable manner.
A map projection is a mathematical transformation that converts the Earth's curved surface onto a flat map, enabling accurate representation of various geographic features such as continents, countries and landscapes. Map projections involve the transformation of coordinates from the Earth's three-dimensional surface to a two-dimensional plane.
The main purpose of map projections is to provide a way to depict the Earth's surface with minimal distortion, ensuring that geographical information remains useful and comprehensible.
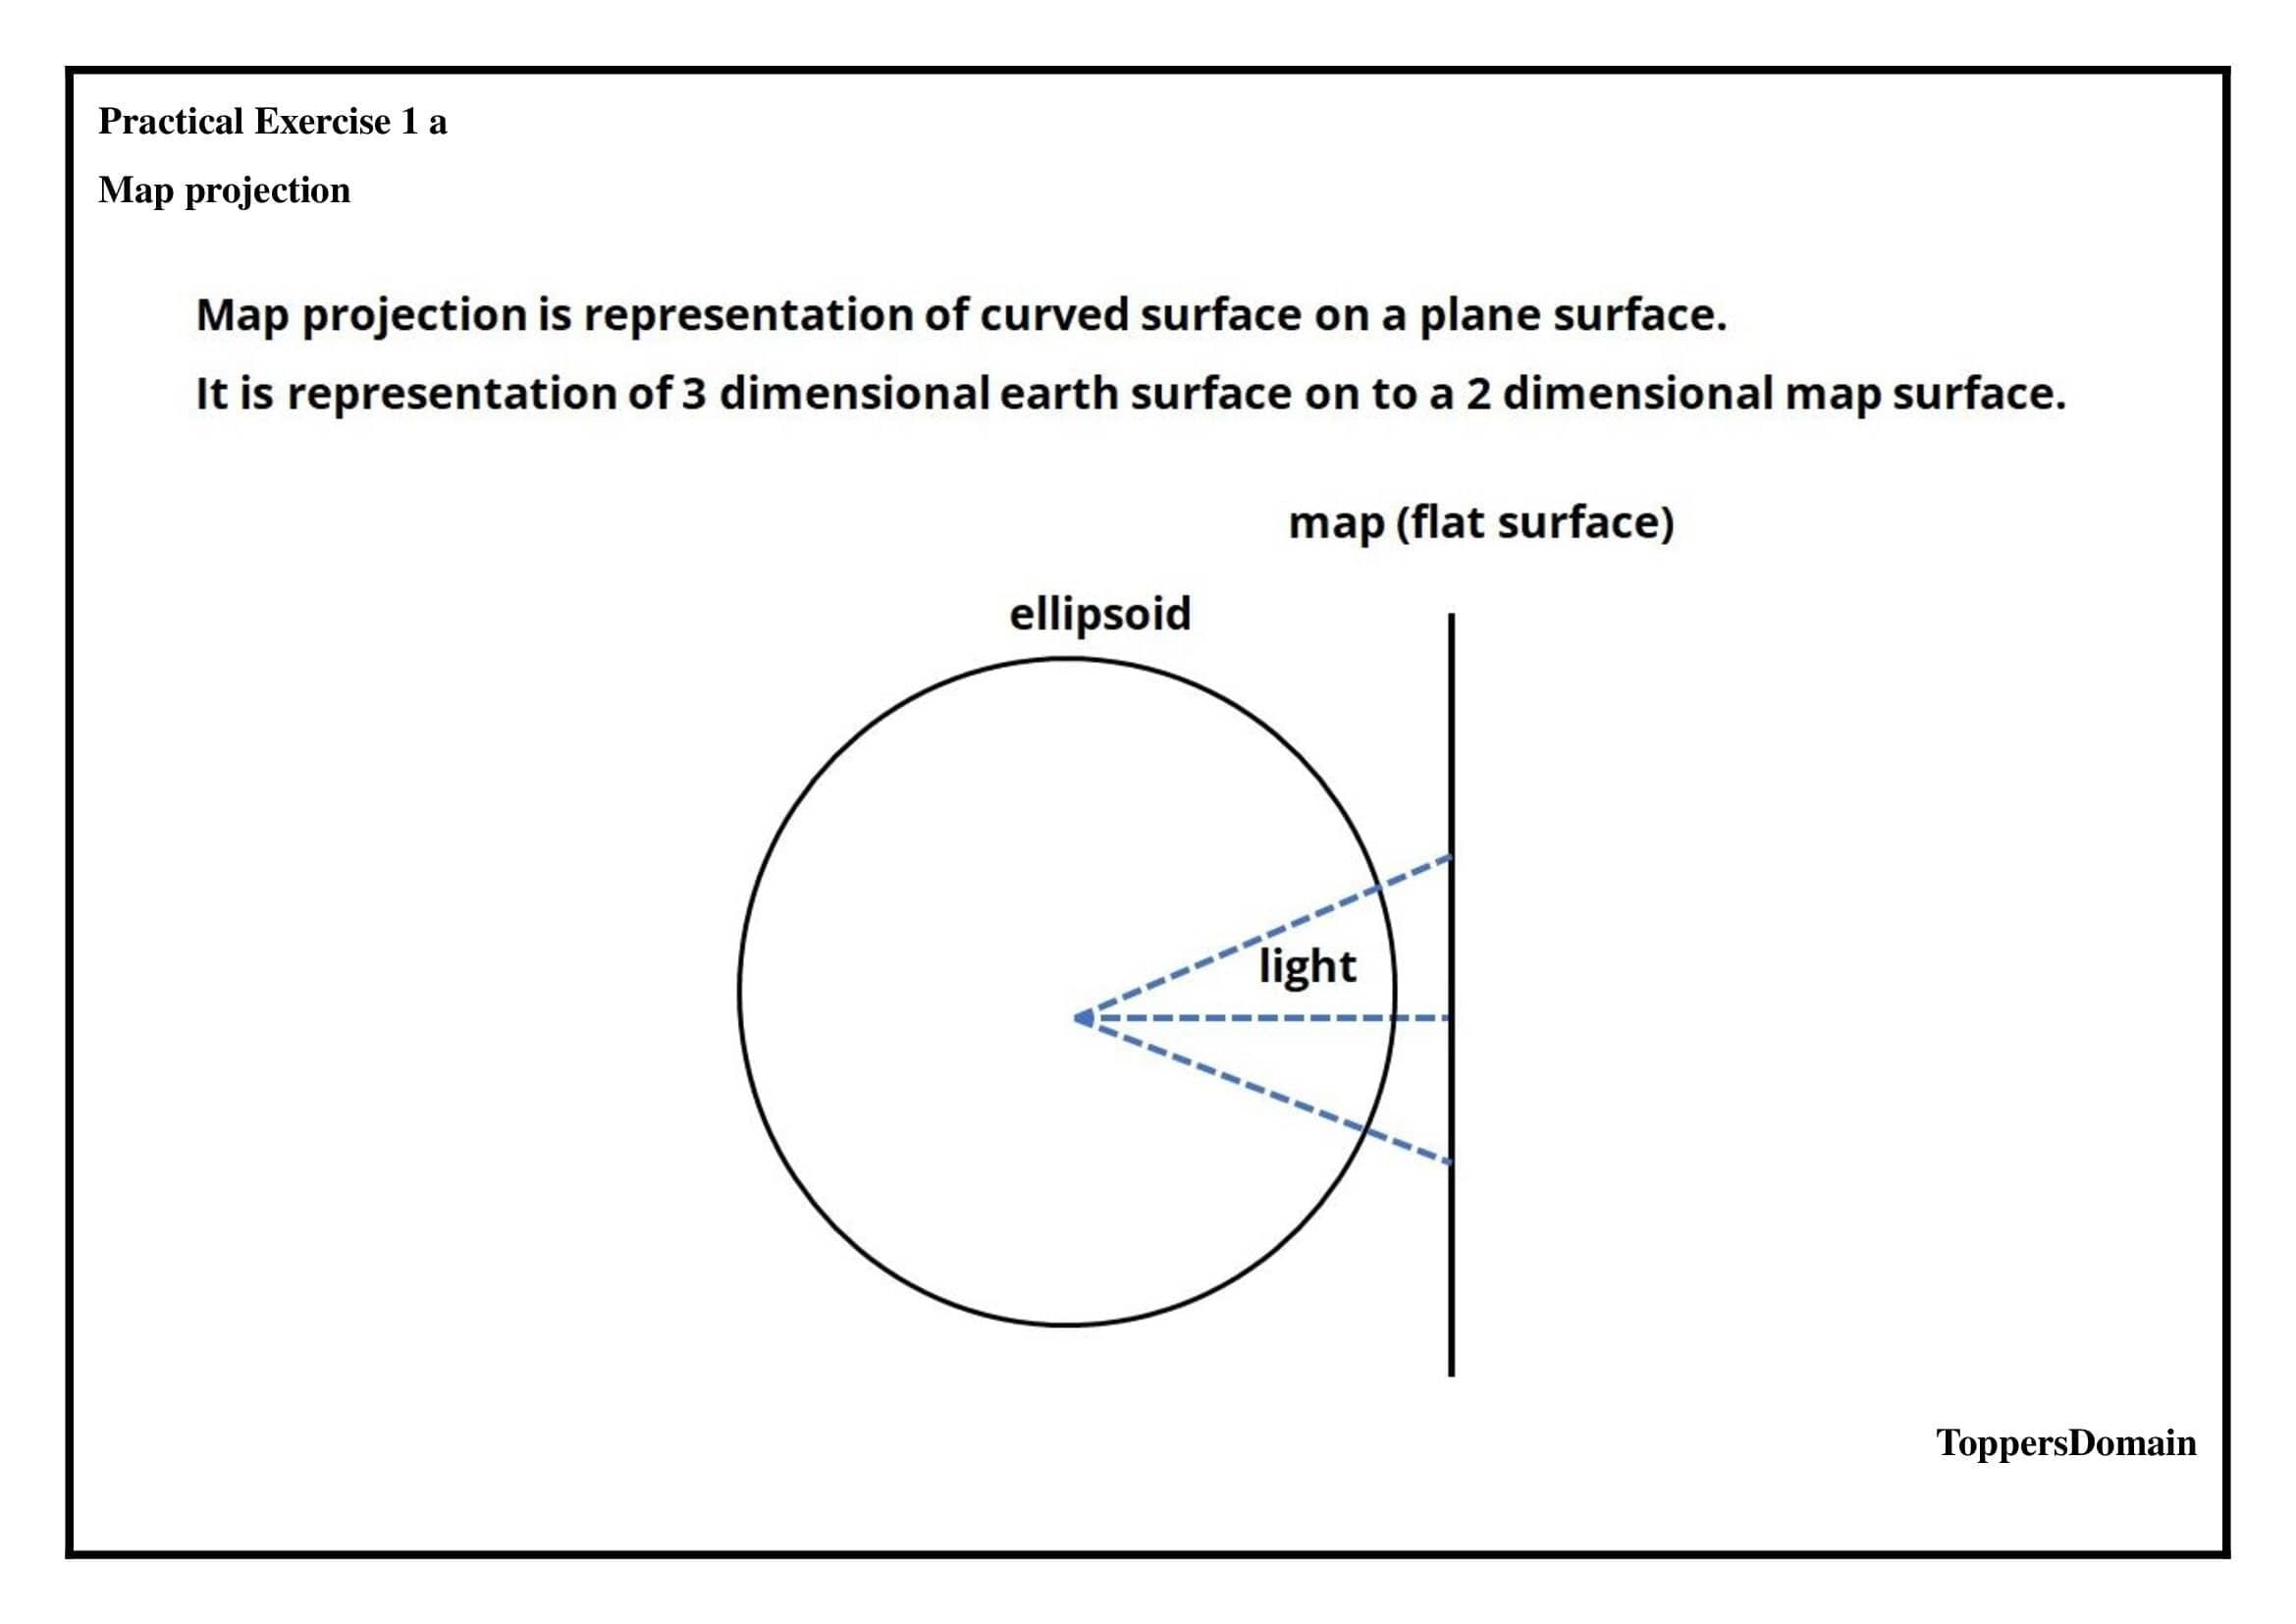
Map projection is an essential technique used to represent the three-dimensional surface of the Earth on a two-dimensional map. It involves transforming the curved surface onto a flat plane. A projection introduces distortions due to the inherent differences between a sphere and a plane.
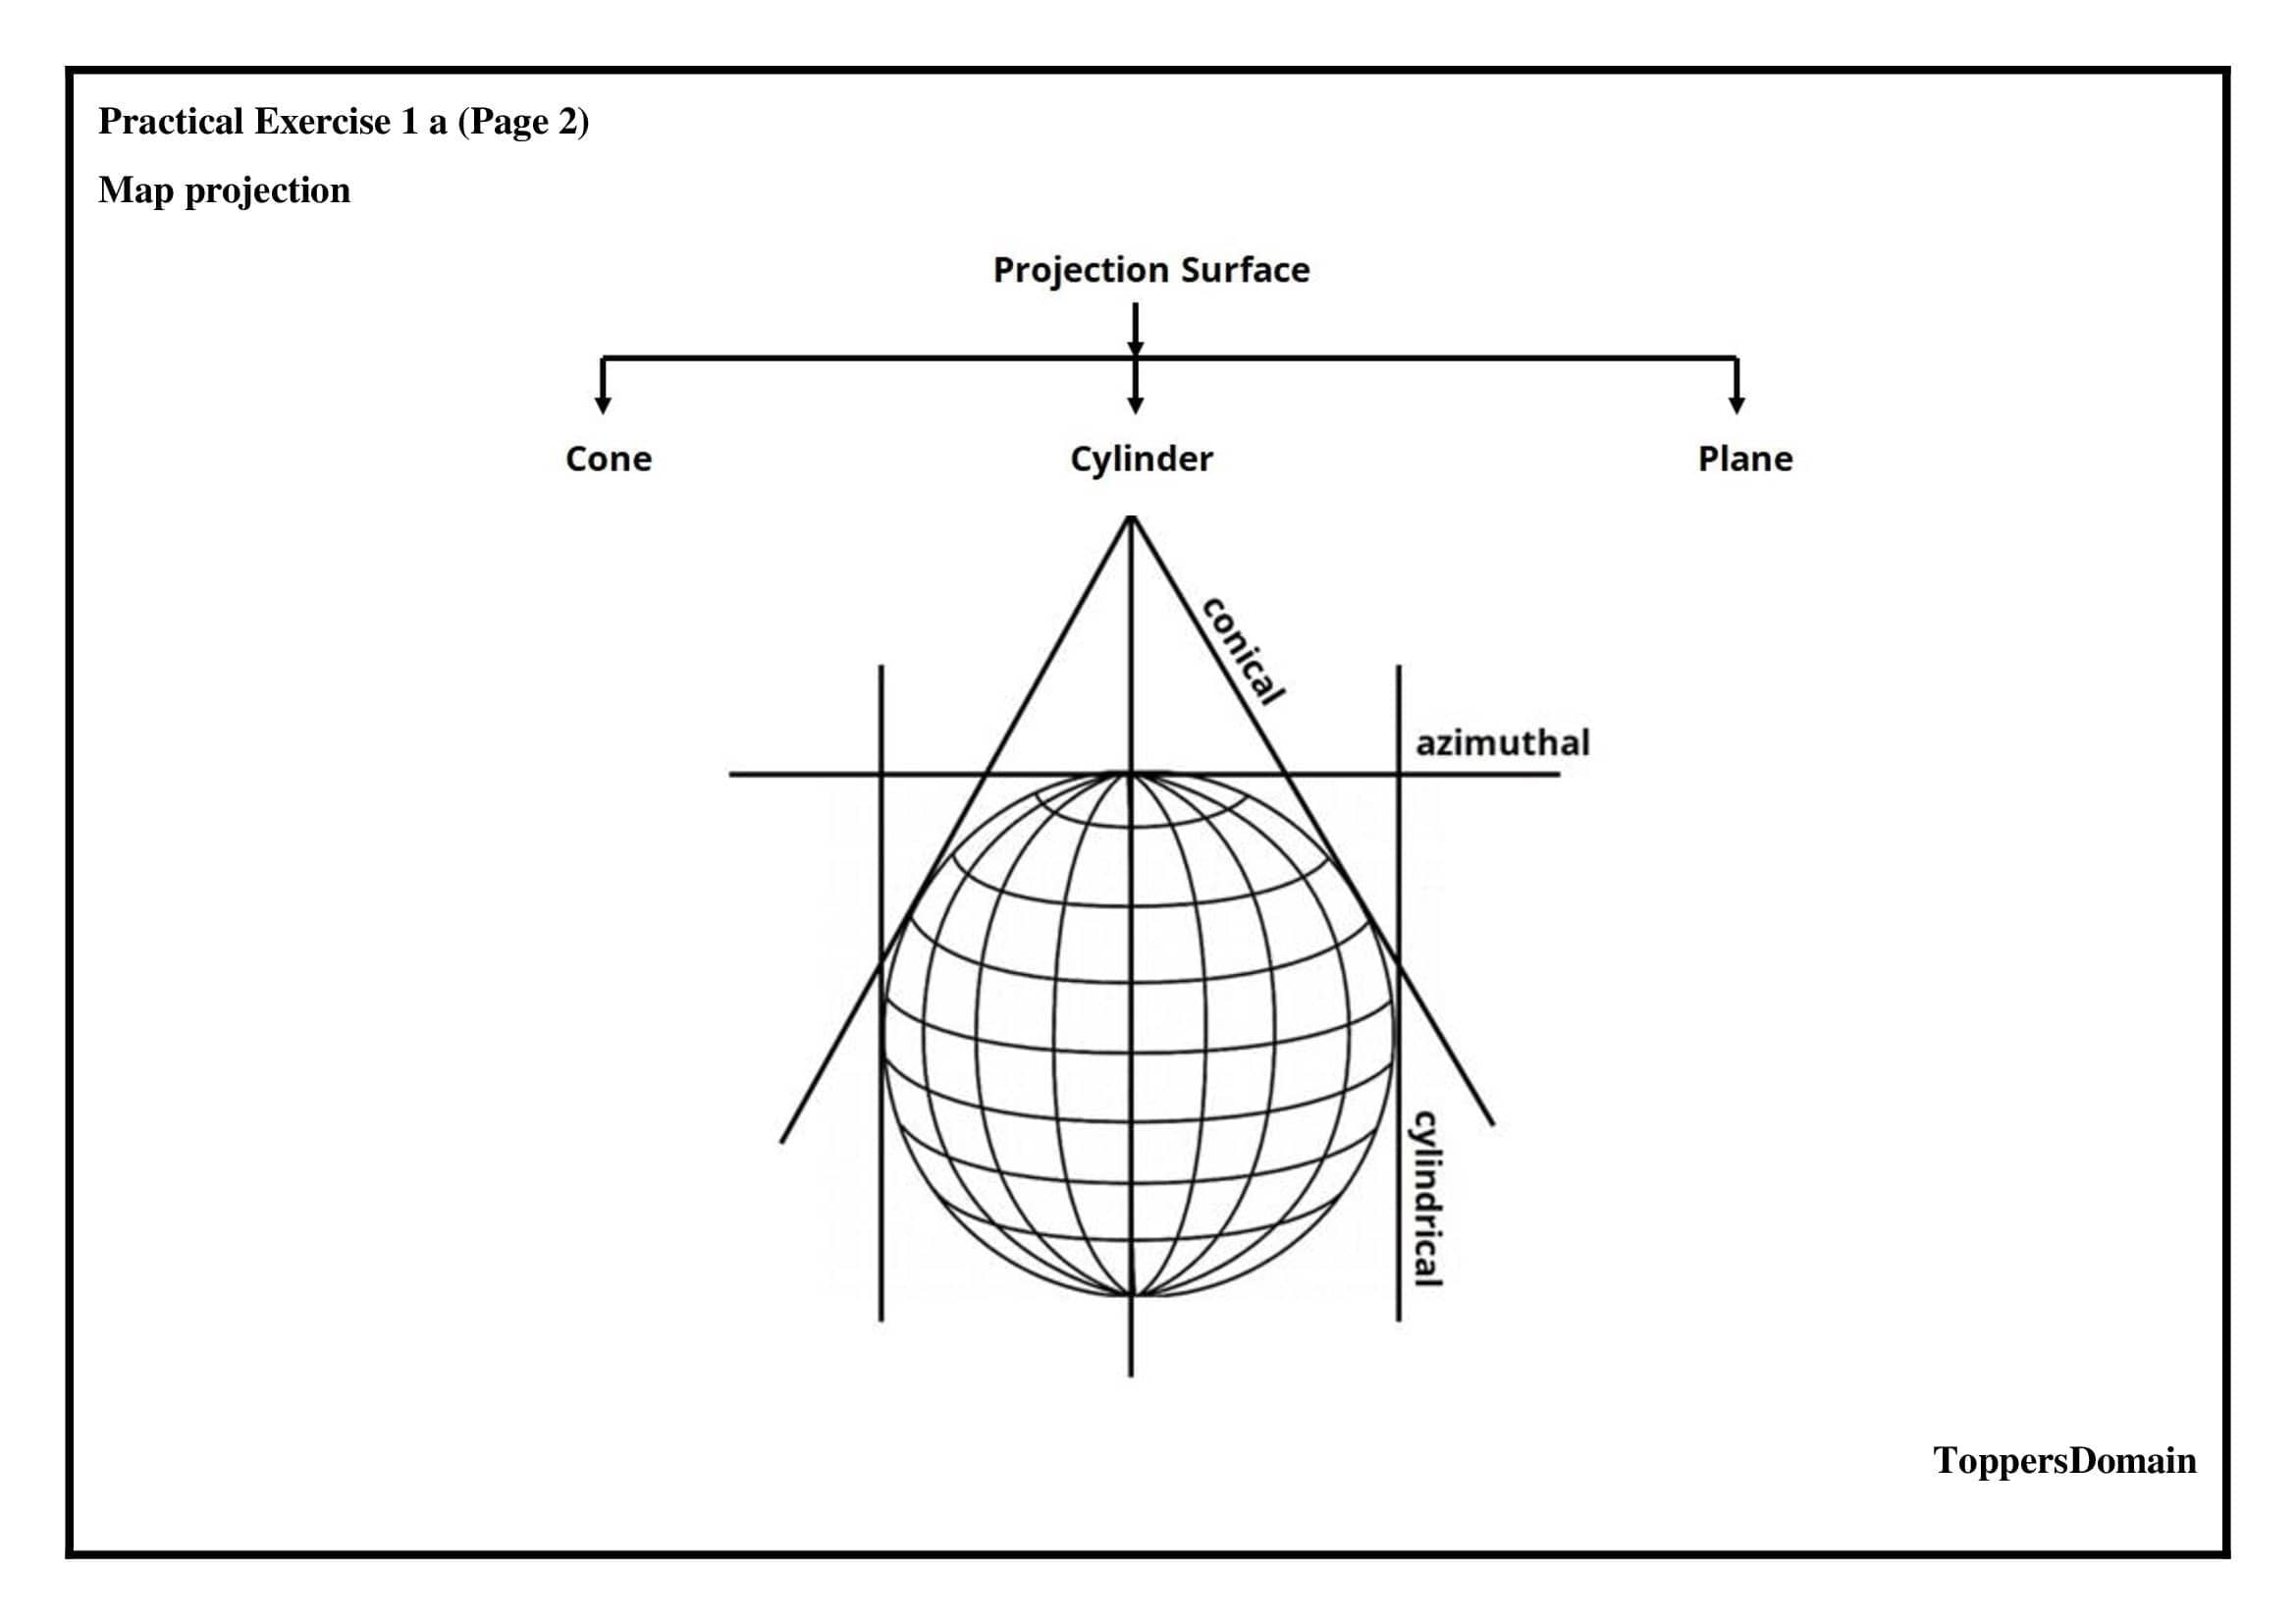
Basic Methods of Map Projection are as follows;
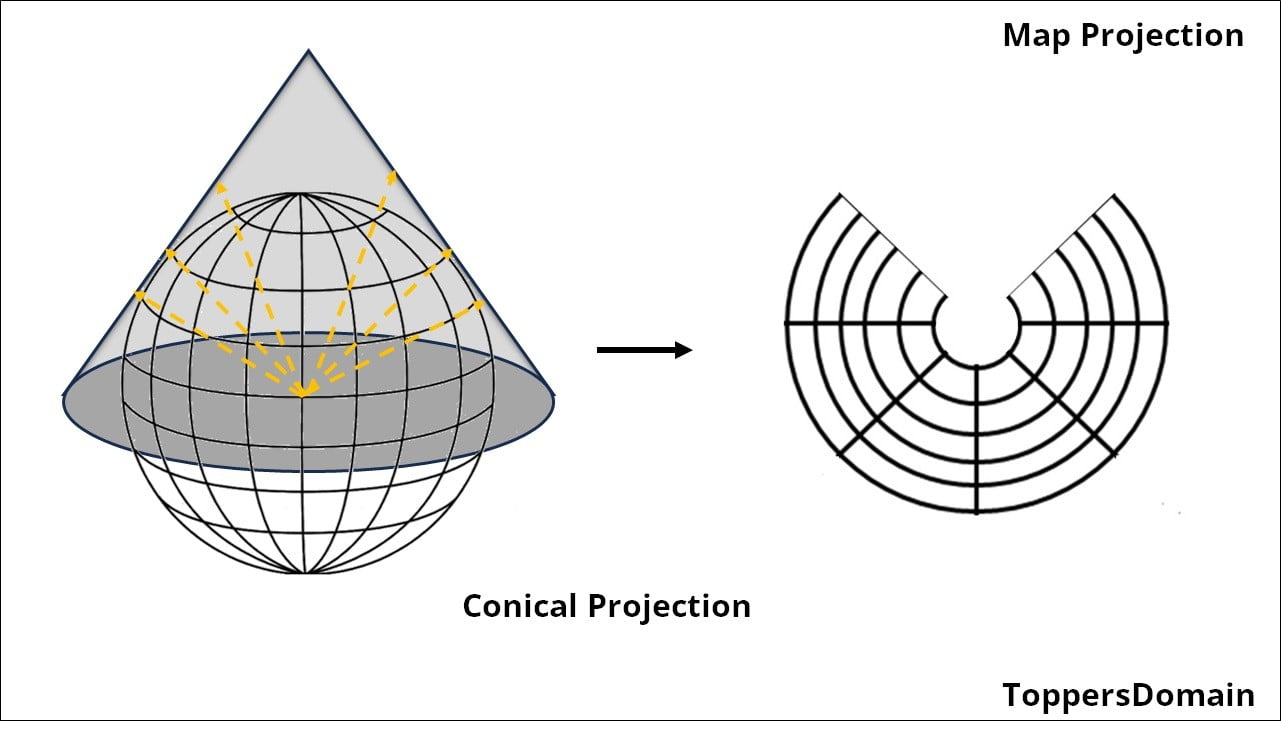
Conic projection involves placing a cone over the Earth and projecting the surface onto a flat map.
Cylindrical projection uses a cylinder to wrap around the Earth and project the features onto a flat map.
Azimuthal projection referred to as planar or zenithal projections, projects the Earth's surface onto a flat plane tangential to a specific point.
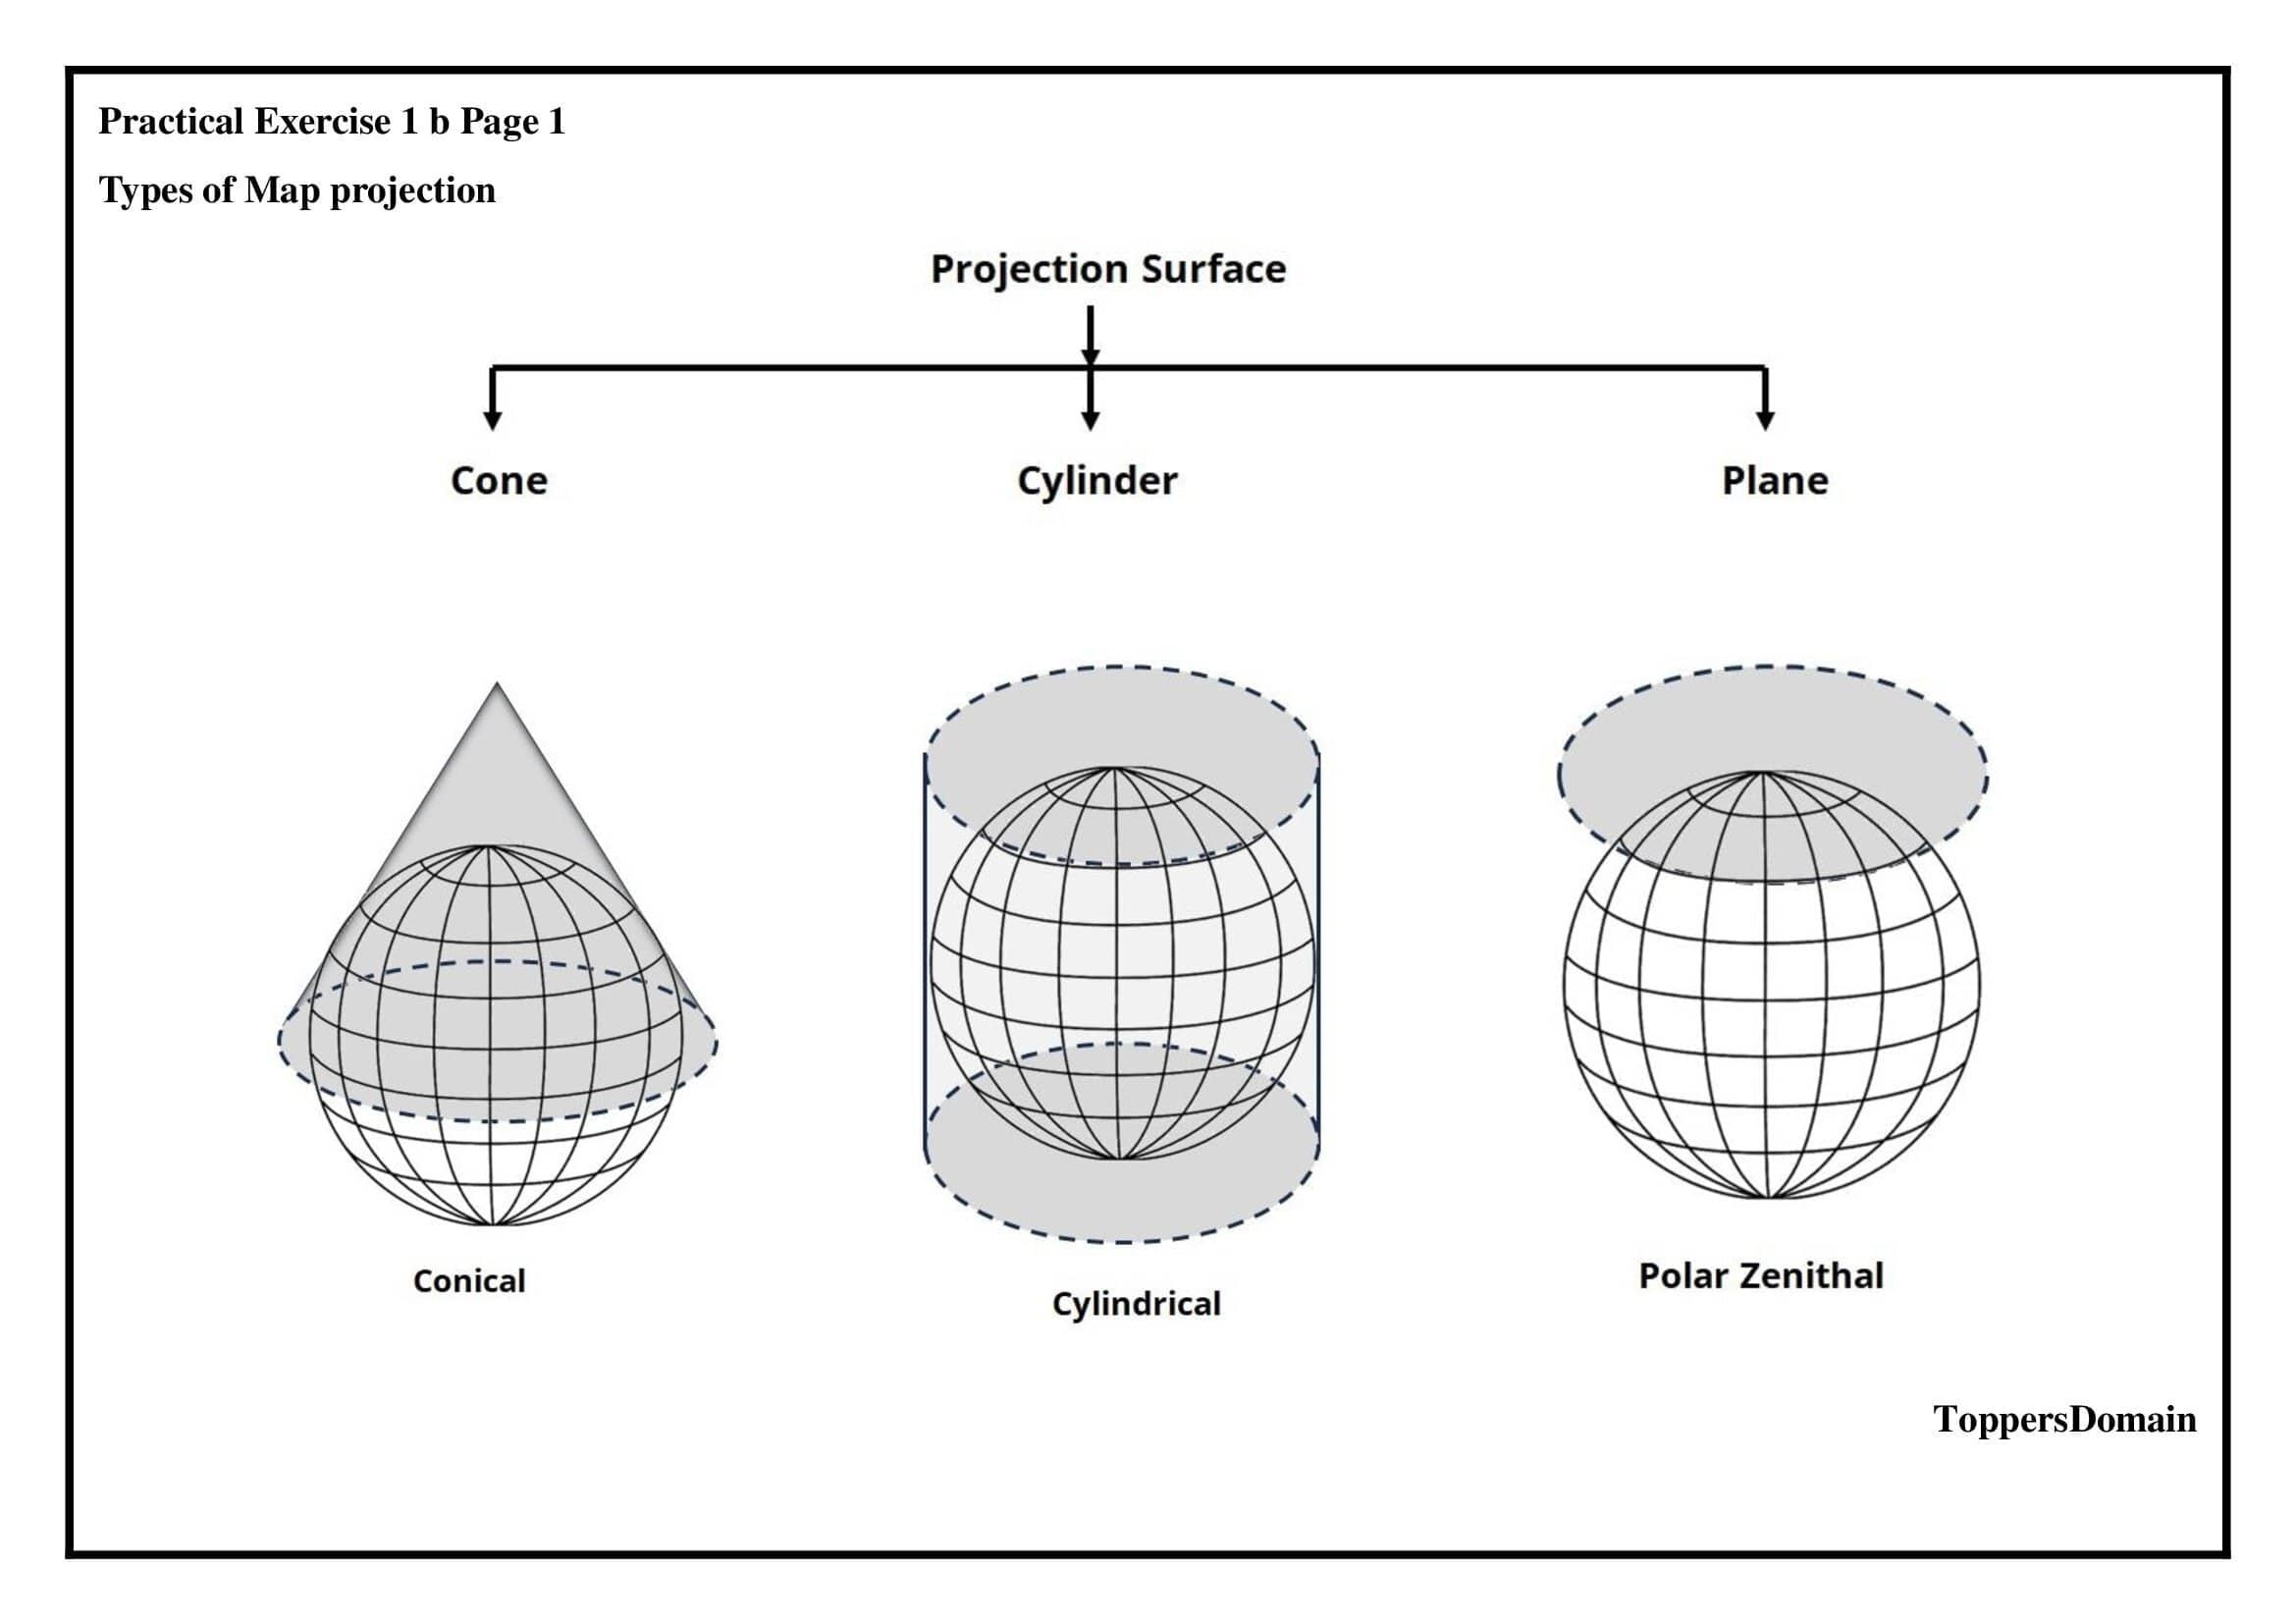
Map projections are techniques used to convert the curved surface of the Earth into a flat map. Since the Earth is spherical, depicting it on a two-dimensional surface presents a challenge. To overcome this hurdle, map projections are utilized.
Below are several types of map projections commonly used:
This projection is often employed to portray regions with an east-west orientation, such as countries or continents. It involves wrapping a cone around the globe and projecting the surface onto a flat map.
It uses a cylinder to project the Earth's surface onto a flat map. The Mercator projection is a well-known example of a cylindrical projection. This type of projection is particularly useful for navigation purposes.
Zenithal or Azimuthal projections involve projecting the Earth's surface onto a plane tangent to the globe. This type of projection provides an accurate representation of distances and directions from a specific central point.
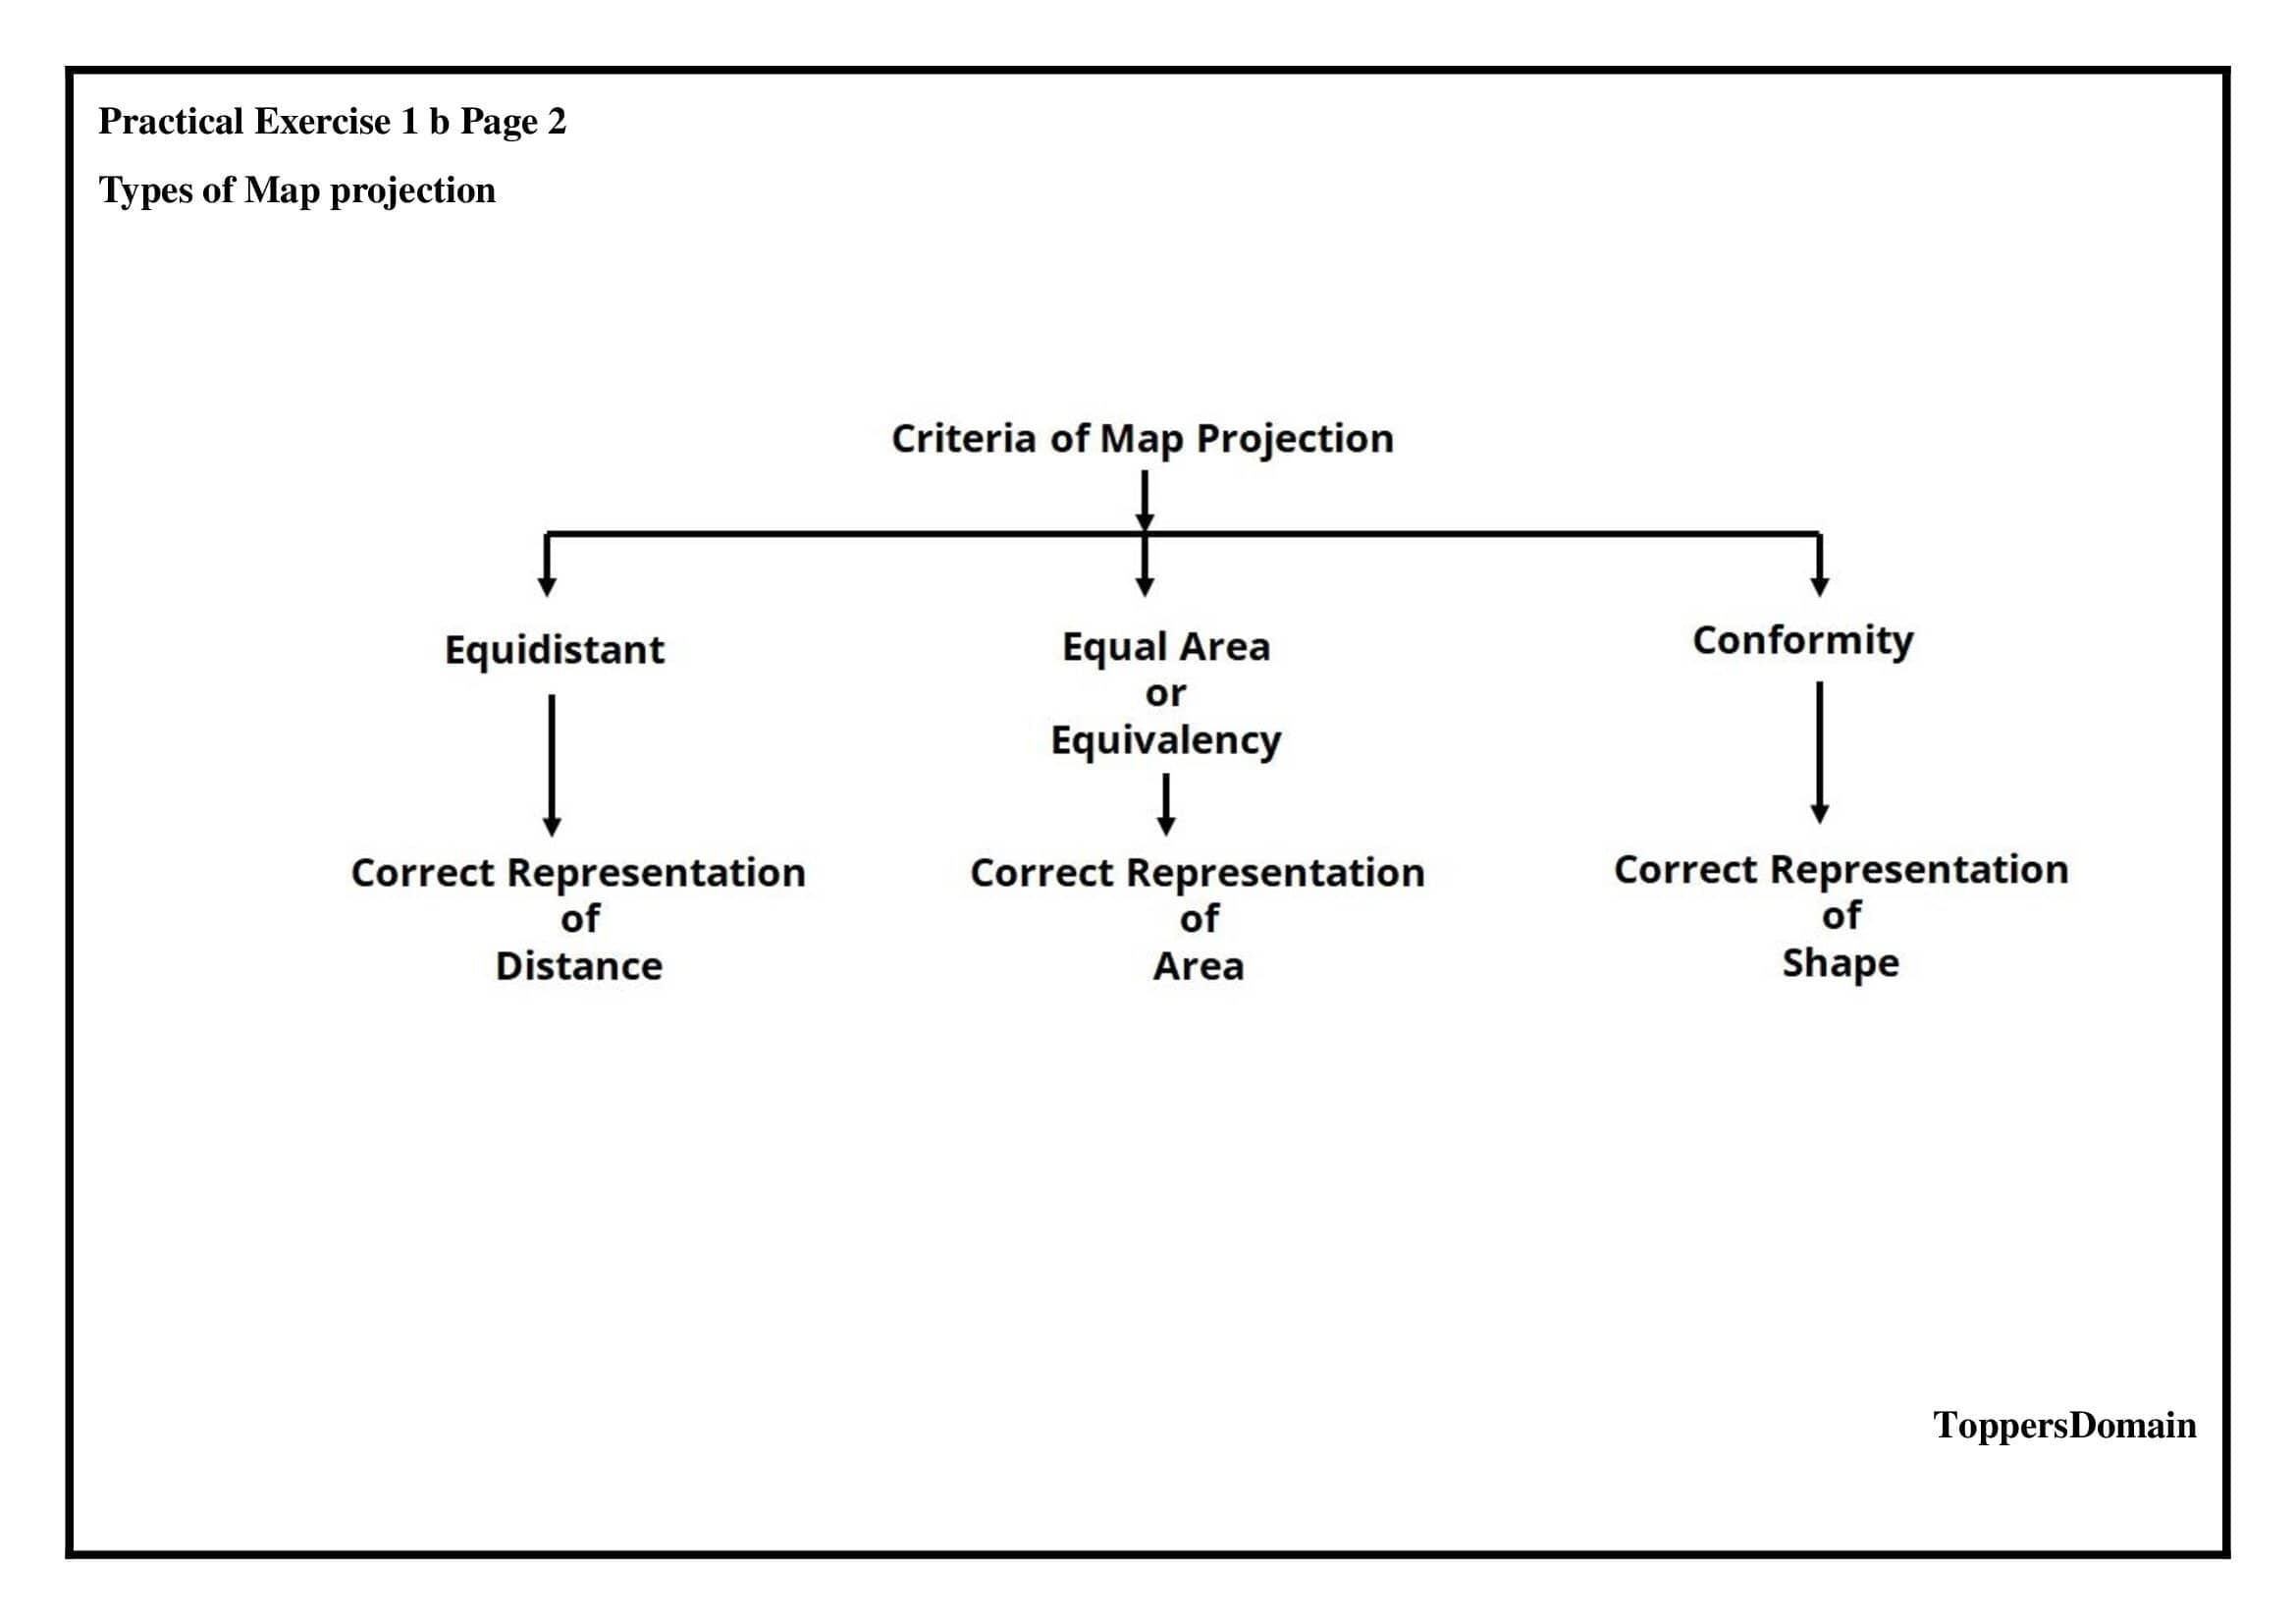
Map projections involve transforming the Earth's curved surface onto a flat surface. There are different criteria of map projection.
Equidistance is a criterion that preserves distances between specific points on the map. This criterion is useful when accurate distance measurements are required. The Azimuthal Equidistant projection is an example of an equidistant map projection.
Equal area map projections aim to maintain accurate relative sizes of landmasses, sacrificing shape and/or direction. One example is the Mollweide projection, which shows continents with correct proportional areas but distorts shapes and distances, making it useful for thematic maps rather than navigation.
Conformality is a criterion that preserves angles locally, ensuring that small shapes and areas on the map resemble those on the Earth's surface. In conformal map projections, the scale varies across the map, distorting the sizes of larger areas. The Mercator projection is an example of a conformal map projection.
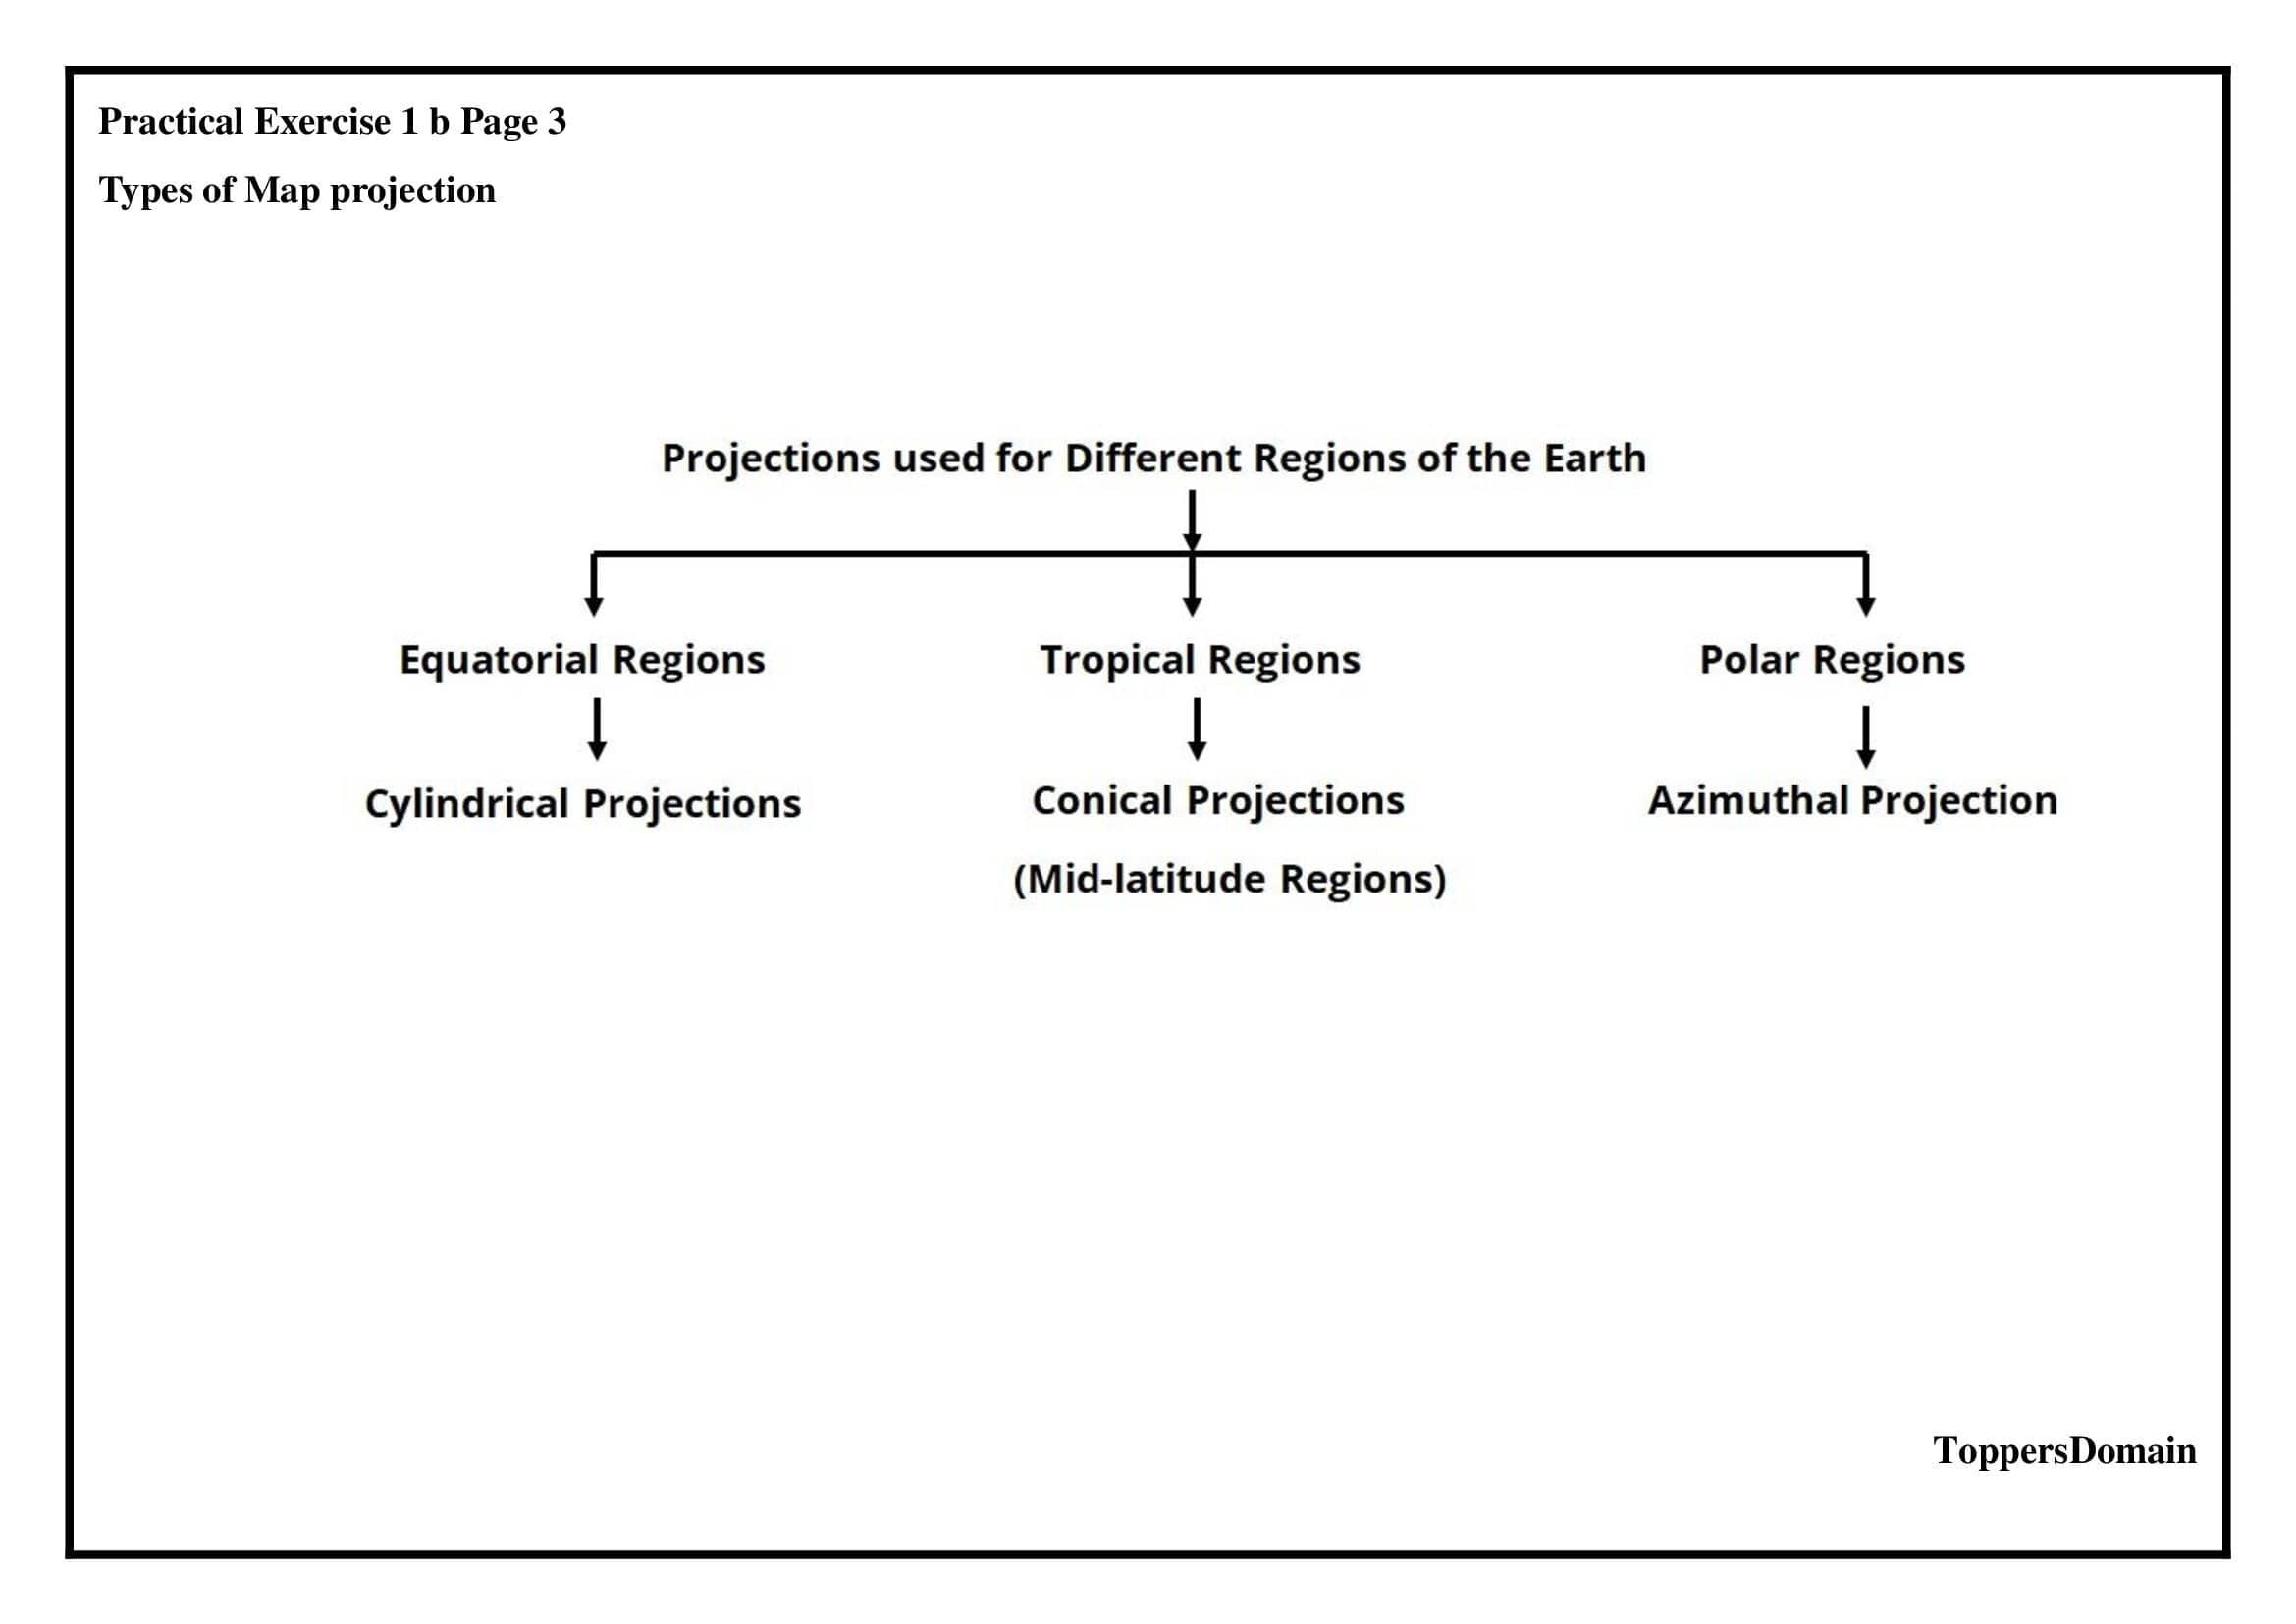
The suitability of a map projection depends on the region being depicted and the purpose of the map. Here is a brief description of the suitability of different map projections for various regions around the world.
Conic projections preserve distances along certain lines and are often used to depict mid-latitude regions, such as countries in Europe or North America.
Mercator projection is a cylindrical projection. It is suitable for navigational purposes, as it provides accurate directions for sea travel. Albers equal area projection is often used for thematic maping, such as population density or agricultural distribution.
Azimuthal equidistant projection preserves accurate distances from a central point. It is commonly used for polar maps. This projection is suitable for depicting the Arctic or Antarctic regions.
Conical projection with one standard parallel, also known as the Lambert conical projection, is a map projection that preserves the shape and size of objects along the standard parallel. This projection is often used for mapping regions that extend primarily in an east-west direction, such as large sections of continents.
Here are the characteristics of this projection:
The projection is formed by placing a cone over the globe, with its vertex at the Earth's centre or somewhere above or below it.
The cone intersects the Earth's surface along a single parallel called the standard parallel. This parallel is selected to minimize distortion along that line.
The meridians are projected as straight lines radiating from the apex of the cone.
The parallels of latitude are projected as arcs of circles, with their curvature increasing away from the standard parallel.
Scale distortion increases away from the standard parallel, meaning that distances and areas are increasingly distorted as one moves farther from this line.
In conical projection, if the cone is positioned over the globe so that it intersects at any two latitudes it is called conical projection with two standard parallels.
The basic characteristics of Conical Projection with Two Standard Parallels are as follows;
It provides flexibility in accurately representing the area of interest on the map. By adjusting the cone's position and angle, different regions can be depicted with minimal distortion.
The areas on standard parallels experience minimal distortion, resulting in accurate representation of shape and area along those lines. This makes conical projection suitable for mapping regions that fall within the selected latitudes. The distortion in conical projection increases, as one moves away from the standard parallels.
Conical projection with two standard parallels is particularly suitable for mapping mid-latitude regions, as it offers a good compromise between minimizing distortion and accurately representing areas of interest.
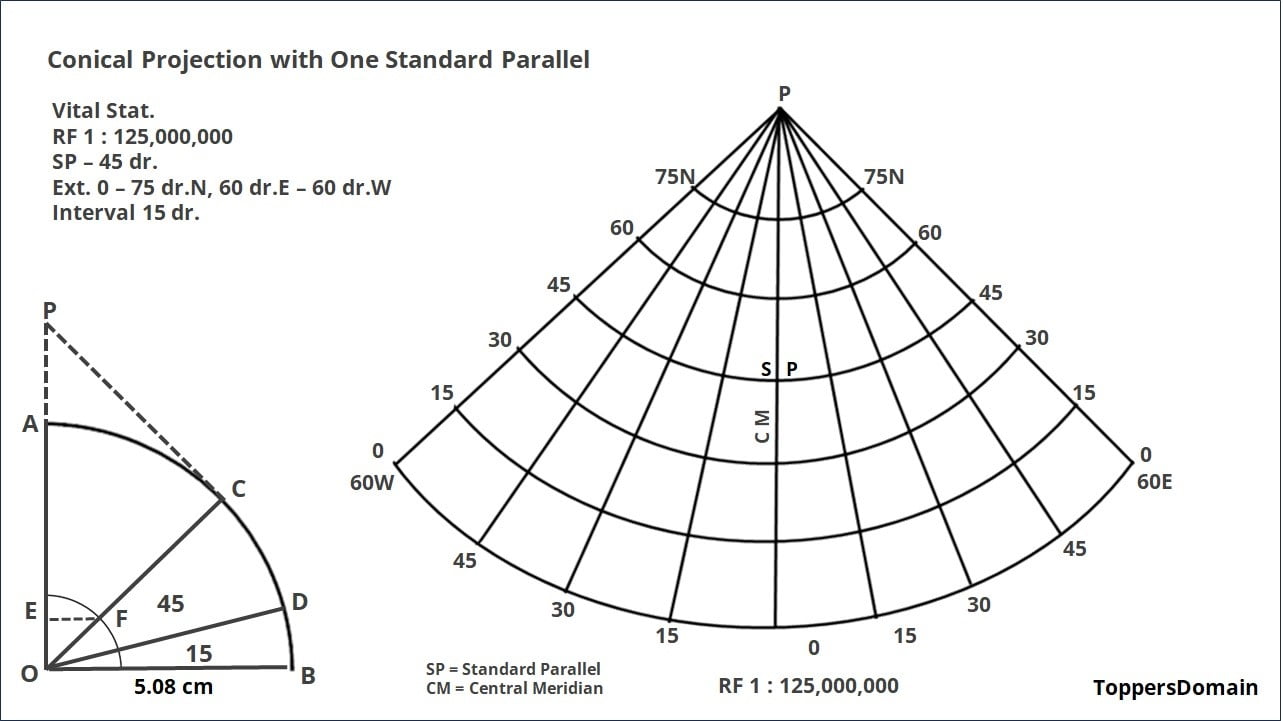
For drawing of graticules, by graphical method,
Calculate the Radius of the Reduced Earth (R)
R = Actual Radius of the Earth / Denominator of the RF
According to the given question, R = 635,000,000 / 125,000,000 = 5.08 cm
Now draw a quadrant of 5.08 cm radius (as given in the enclosed diagram).
Next, draw angles of 15° (BOD) and 45° (BOC)
Further, draw a tangent (perpendicular) on C (PC)
Extend the OA line to join the tangent on C (PC); it is OP,
Next, draw a quadrant on O of BD (distance), then draw a perpendicular on OA that is EF, as in diagram. (EF gives the spacing for the meridian at 15° intervals)
For graphical drawing of graticules, draw an upright straight line from P’, it represents the Central Meridian.
Next draw a semi-circular line from P’ of the length of PC, it represents the line of Standard Parallel (45°)
BD is the spacing the parallel at 15° intervals, mark the points for the parallels on the Central Meridian (BD is the distance between the successive parallels)
Next draw semi-circular lines (for successive distance of BD) from P’ for each parallel on the Central Meridian.
EF is the spacing for the meridian at 15° intervals, mark the points for Meridians on the Standard Parallel
Next draw lines from P’ for each Meridian (by joining the marked points on the Central Meridian)
Next Step (As given in the enclosed diagram)
Draw Parallels – 0°, 15°N, 30°N, 45°N, 60°N, 75°N
Draw Meridians – 60°E, 45°E, 30°E, 15°E, 0°, 15°W, 30°W, 45°W and 60°W
The resultant is a graticule for conical projection with one standard parallel.
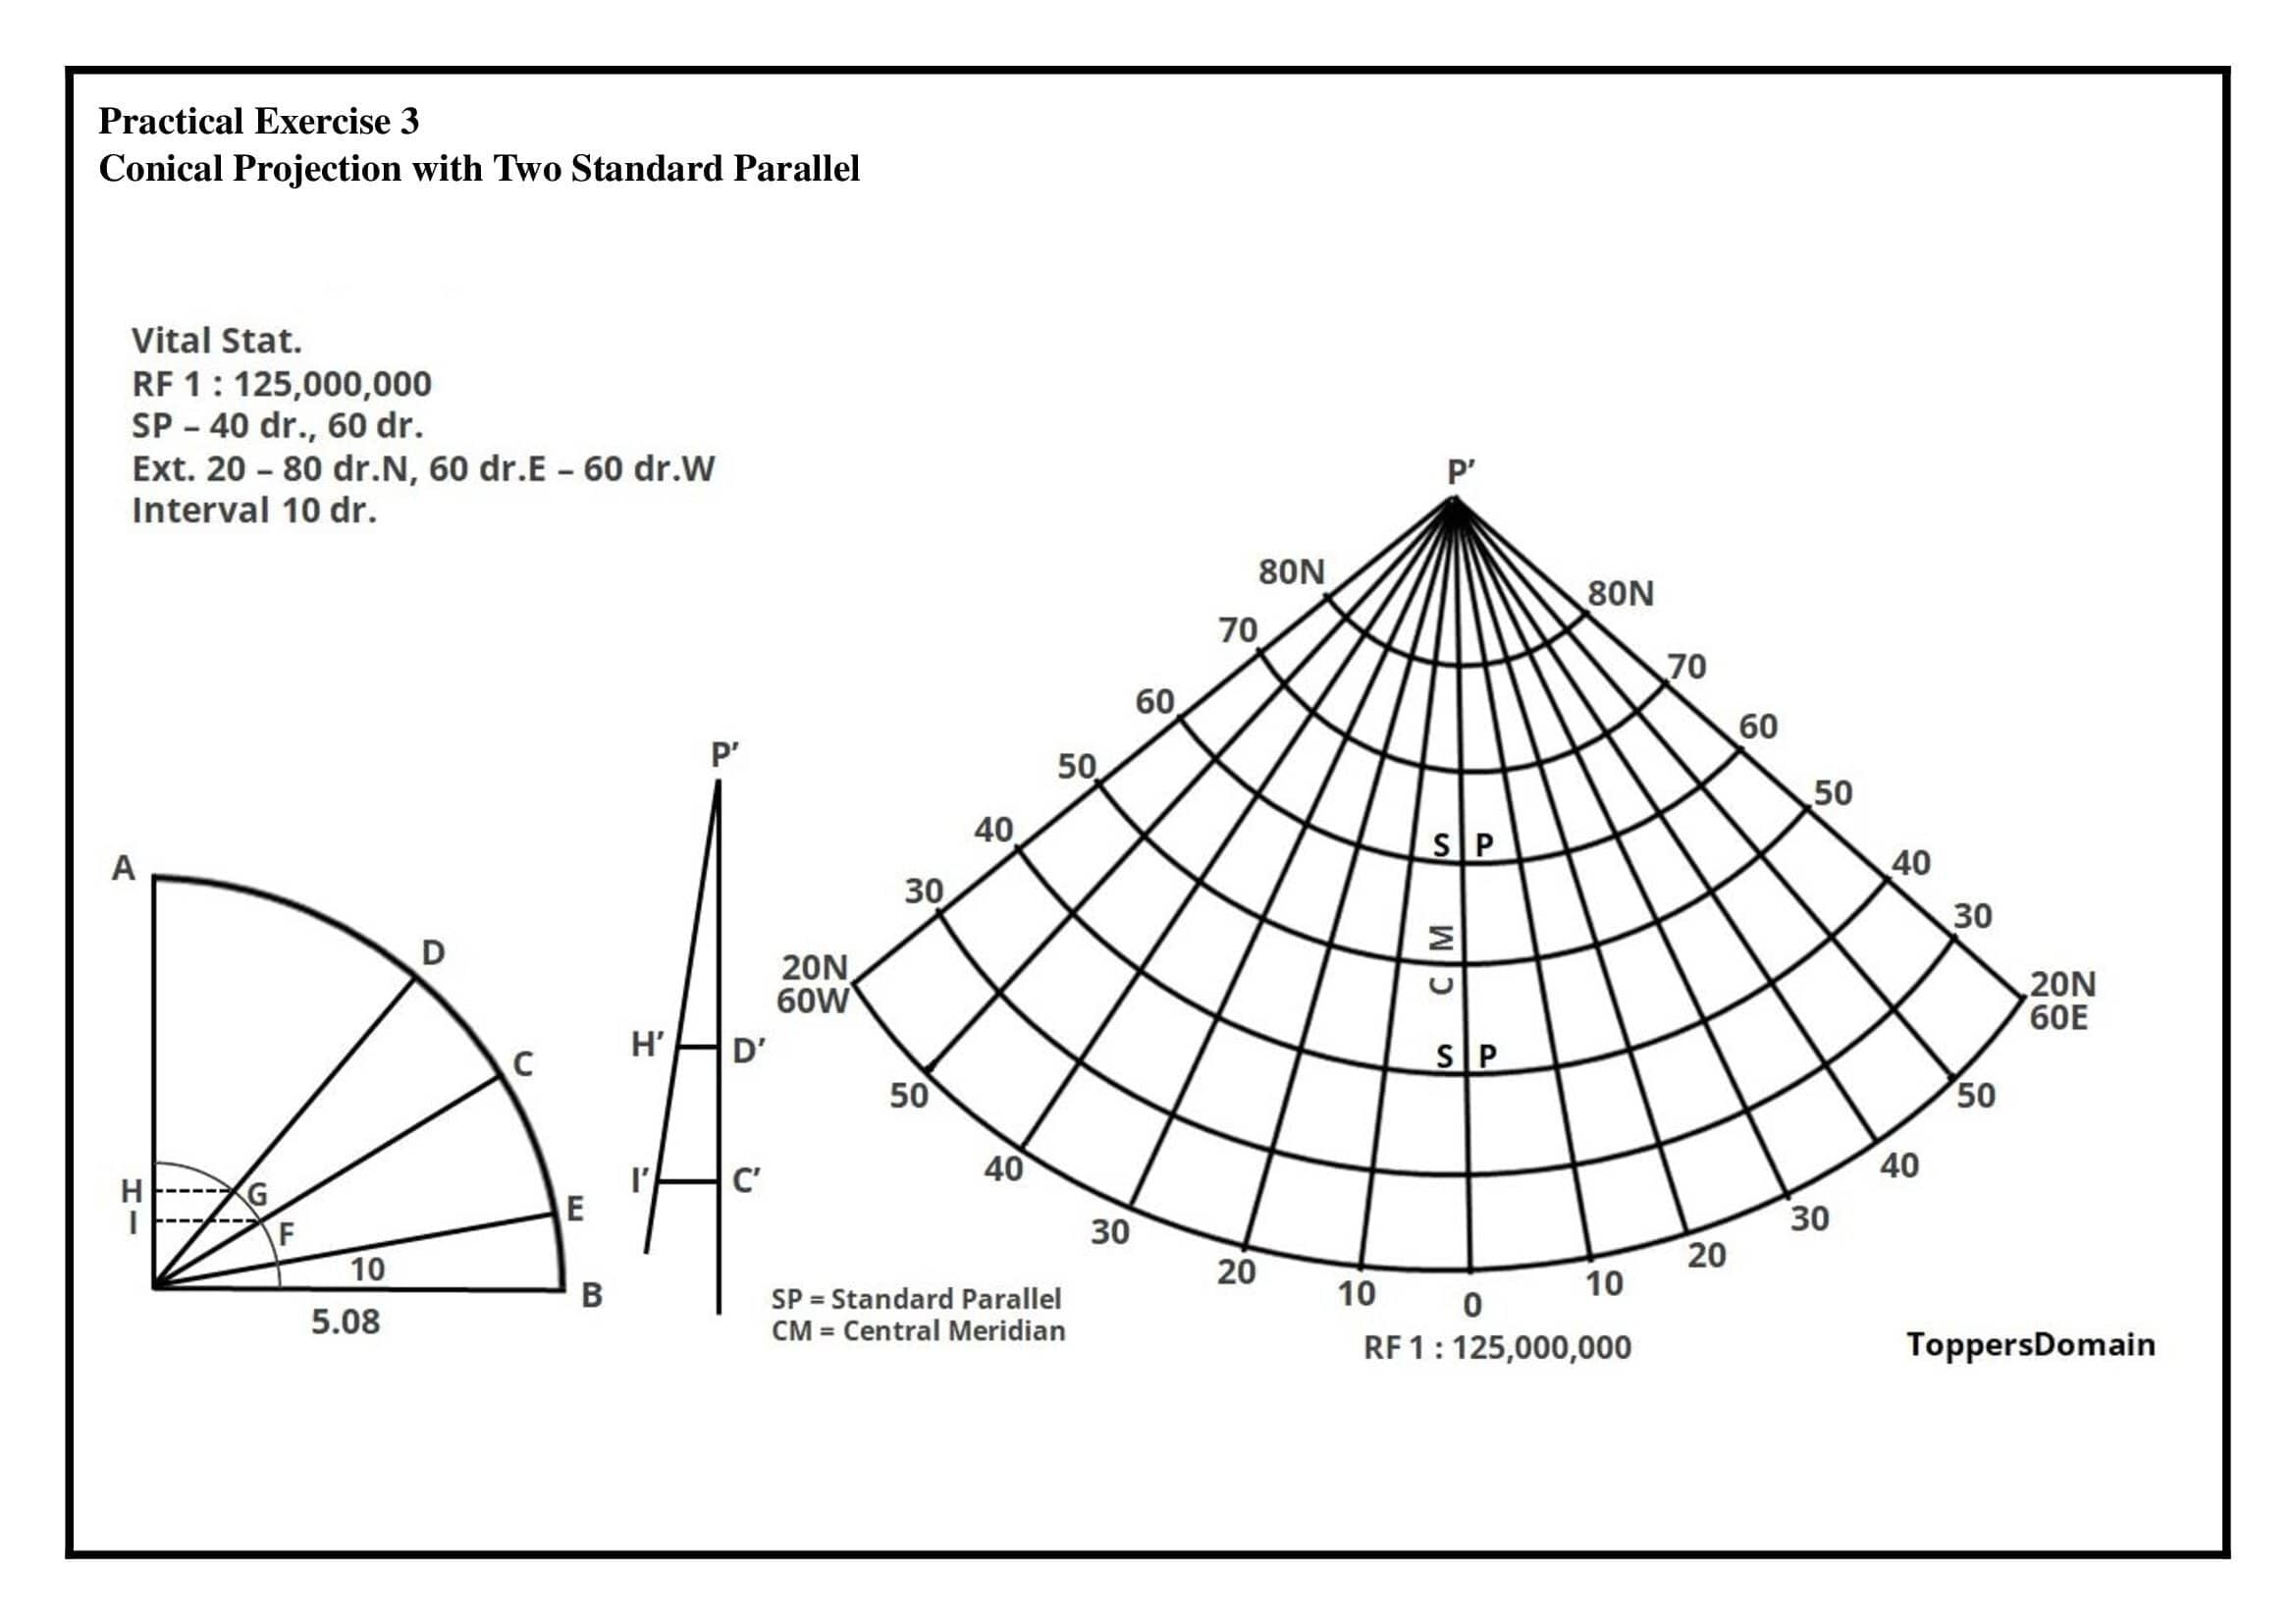
For drawing of graticules, by graphical method,
Calculate the Radius of the Reduced Earth (R)
R = Actual Radius of the Earth / Denominator of the RF
According to the given question, R = 635,000,000 / 125,000,000 = 5.08 cm
Now draw a quadrant of 5.08 cm radius (as given in the enclosed diagram).
Next, draw angle of 10° (BOE) for interval of lat. and long.
Again, draw angles of 40° (BOC) and 60° (BOD) for given Standard Parallels
Next, draw a quadrant on O of EB (distance) that cuts OC and OD at F and G, then draw perpendiculars from F and G on OA that is FI and GH, as in diagram.
Next, draw a perpendicular line and mark C’ D’ points, equal to the distance of CD. Draw perpendicular line C’I’ and D’H’ equal to the length of FI and GH on C’ and D’. Further draw a straight line joining I’ and H’. Extend the C’ – D’ line to join I’ – H’ line to intersect on P’.
The length of P’C’ and P’D’ gives the angular distance of 40° and 60° standard parallels.
For graphical drawing of graticules, draw an upright straight line from P’, it represents the Central Meridian.
Next draw a semi-circular line from P’ of the length of P’C’ and P’D’, it represents the lines of Standard Parallel (40° and 60°)
For drawing of graticules, draw a vertical line P’G’ as given in the enclosed diagram. Assume it to be the Central Meridian.
Next draw semi-circular lines on the Central Meridian with a distance of P’C’ and P’D’ (for successive Standard Parallel - 40° N and 60° N) from P’.
Measure the mid value of both the Standard Parallel (40° N and 60° N), it is equal to EB. It represents the 50° latitudes. Draw semi-circular lines from P’ on the Central Meridian with an added distance of mid value of both P’C’ and P’D’.
BD is the spacing the parallel at 10° intervals, mark the points for the parallels on the Central Meridian (BD is the distance between the successive parallels)
GH is the spacing for the meridian at 10° intervals on the Standard Parallel of 60° N. Mark the points for Meridians (longitudes) on the Standard Parallel of 60° N
Similarly, FI is the spacing for the meridian at 10° intervals on the Standard Parallel of 40° N. Mark the points for Meridians (longitudes) on the Standard Parallel of 40° N.
Next draw lines from P’ for each Meridian (by joining the marked points on the Central Meridian).
Next Step (As given in the enclosed diagram)
Draw Parallels – 20°, 30°N, 40°N, 50°N, 60°N, 70°N and 80°N
Draw Meridians – 60°E, 50°E, 40°E, 30°E, 20°E, 10°E, 0°, 10°W, 20°W, 30°W, 40°W, 50°W and 60°W